Personal collection of useful tricks and templates for writing in Latex
Plots with MatplotLib/main.tex
% Written by Bibby AI
\documentclass[11pt]{article}


\usepackage{amsmath}
\usepackage{pgfplots}
\usepackage{siunitx}
\usepackage{pythontex}
\newcommand{\pymultiply}[2]{\py{#1*#2}}


\begin{document}

\begin{pycode}
print("Python says ``Hello!''")
\end{pycode}

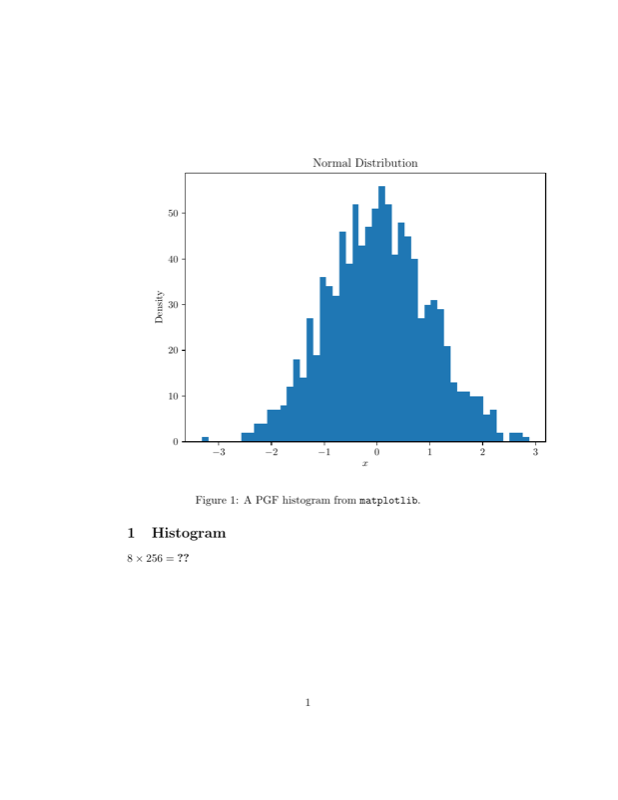
\section{Histogram}

\begin{figure}
	\centering
        \input{histogram.pgf}
    \caption{A PGF histogram from \texttt{matplotlib}.}
\end{figure}

$8 \times 256 = \pymultiply{8}{256}$


% Written by Bibby AI
\end{document}
PDF Preview
Create an account to compile and preview